Identifying strong object orientations within an image
Finding the orientation of strong edges of objects is a relatively straightforward digital image processing (DIP) task that can have very useful applications. The method described below for example, was used to reduce the complexity of a convolutional neural network (CNN) trained to find potential grasping points for a robotic gripper. By rotating the object image prior to detection, the model didn’t need to learn rotation-invariant features—thereby simplifying the classification task and the resulting model.
This method utilises a Sobel filter, so it’s performance will increase as the contrast between object and background increases. As such, I have used high-contrast example images of single objects to help illustrate object orientation detection in an ideal application. Depending on your requirements, you may have to preprocess your image so that the object of interest is the main feature of your image—diminishing the impact of strong background edges as much as possible. Object detection and segmentation are separate tasks to orientation detection, with lots of interesting and emerging solutions depending on complexity.
Let’s run through the process by finding strong edge orientations for the hex key below:
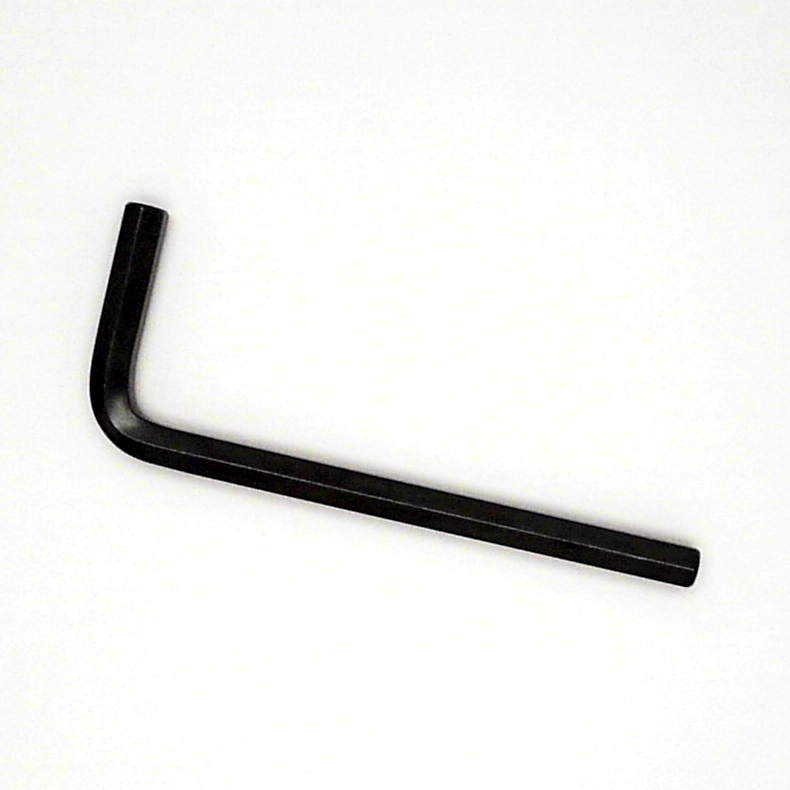
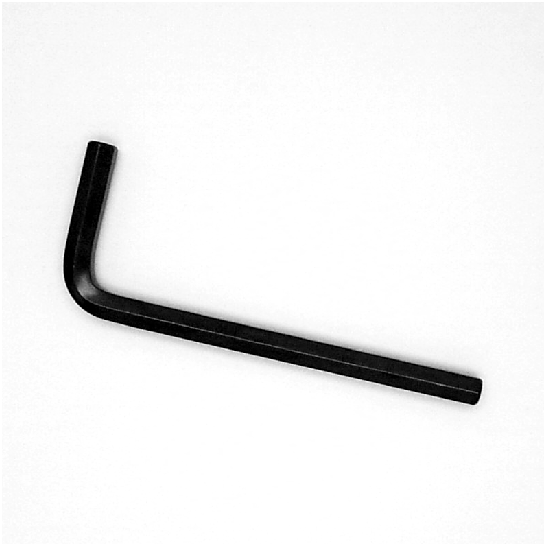
The example object has a bunch of strong edges highly visible against the white background. Intuitively, we think of this key as having several orientations, e.g., oriented parallel to either of the lengths of the key. To find these orientations systematically, we begin by converting the image to greyscale:
We then apply our convolving Sobel operator to each pixel:


where gradient_x and gradient_y are the horizontal and vertical gradient values of a pixel, respectively. θ_gradient is the resultant gradient direction.
From here we have a couple of options. Statistics from θ_gradient can be tabulated in the form of a histogram that counts the number of occurrences of each pixel angle within bins ranging from -180° to 180°. Computing this histogram for the above object, given a bin size of 5°, produces the following graph:

This histogram of Sobel gradient directions highlights strong responses from the Sobel filter, i.e., strong edge orientations of the object within the image are reflected by the peaks of the histogram.
At this stage we could rotate our image by the angles provided by this histogram, but because of the binning operation, our maximum resolution is set by the bin size—in this case, 5°. Setting our bin size to 1° would be preferable, but this often produces multiple local peaks near global peaks due to noise:

In the above image, we can see that some global peaks are comprised of multiple local peaks, e.g., [-5° … -20°], [75° … 80°] and [165° … 170°]. We could select our object angles from this histogram, but that would require selecting between local peaks and making sure there is some minimum distance between peaks to avoid selecting values too close to each other. Our maximum resolution would still be tied to the bin size.
Instead of casting our results as discrete values in a histogram, we can consider our data to be continuous. A moving filter may then be applied to smooth our trend:

In the above example, the implemented moving average has a span of 5. Now that we have cleaned up our graph a bit, we select the global peaks. In this case, they are located at [-102° -11° 78° 169°]. Rotating our image by these amounts clearly illustrates the detected orientations by aligning them with the horizontal:

[-102°]

[-11°]

[78°]

[169°]
See below for some more examples:


[-162°]

[-71°]

[-10°]

[18°]

[109°]

[173°]


[-67°]

[19°]

[116°]

[153°]
The methodology breaks down in some situations. If the object is circular for example, there are no strong edges to detect:


Similarly, there are no strong edges to detect for threaded objects. As the surface isn’t smooth, many opposing angles are captured:


Hopefully this post has helped those interested in finding strong object rotations within an image using a Sobel-based methodology—as opposed to calculating the axis of minimum inertia, which takes the entire object into account.
You can download an implementation in Matlab by clicking the following link: